Driving Lessons in Rye
You'll find three driving schools and six independent driving instructors in Rye, with four of the independent driving instructors being female. The schools average 4.2 stars, though pricing information isn't currently available for any of them. With a dozen London-area test centres nearby, pass rates vary widely from Sevenoaks at 59% down to Belvedere at 40.5%, making it essential to choose an instructor who knows the specific test centre you'll be using.
- 3
- driving schools
- 6
- independent instructors
- 11
- test centres
Driving lessons in Rye
3 driving schools and 6 independent instructors.
Don't mind who teaches you?
Fill in the form and we'll find an available instructor.
6 instructors across Rye · Free · Takes less than a minute
Showing 1–3 of 3 driving schools, plus every independent instructor in Rye.
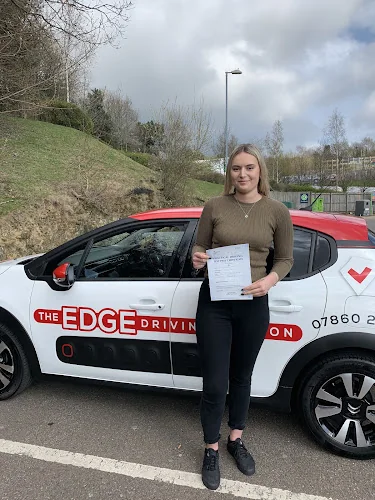
THE EDGE DRIVING SCHOOL HASTINGS
Colin Stevens Driving School
Jamie’s rye driving school
Adaline Bourne
Lloyd Carey
Sarah Carter
Tracy Noble
Catherine Saba
Colin Stevens
Rye Test Centres and Pass Rates
The Rye area covers 11 centres with 112,329 tests between 2025 and 2026, making it one of the largest groupings. Sevenoaks tops the pass rates at 59%, with women at 61.3%, men at 57.2%, automatic at 54.2%, and a 10 week wait. Roads around Barking (Tanner Street) include dense North Circular traffic and multiple lanes, with the lowest pass rate at 36.3% (men 37.5%, women 34.3%, automatic 33.4%) and a 16 week wait. Sidcup (London) achieved 58.7% for both men and women, with automatic at 56.7% and an 18 week wait, while Bromley sits at 52.9% with a 9 week wait. Hornchurch and Goodmayes have the longest waits at 23 and 21 weeks respectively, with pass rates of 46.3% and 43.7%.
Sevenoaks
6,740 tests taken · 10 week waitSidcup (London)
14,318 tests taken · 18 week waitBromley (London)
13,228 tests taken · 9 week waitErith (London)
5,809 tests taken · 7 week waitWest Wickham (London)
12,249 tests taken · 11 week waitTilbury
5,083 tests taken · 7 week waitMitcham (London)
15,046 tests taken · 12 week waitHornchurch (London)
8,694 tests taken · 23 week waitGoodmayes (London)
21,374 tests taken · 21 week waitBelvedere (London)
4,245 tests taken · 9 week wait| Test Centre | Female | Male | Automatic | Overall | Tests | Wait |
|---|---|---|---|---|---|---|
| Sevenoaks | 61.3% | 57.2% | 54.2% | 59.0% | 6,740 | 10 weeks |
| Sidcup (London) | 58.7% | 58.7% | 56.7% | 58.7% | 14,318 | 18 weeks |
| Bromley (London) | 49.5% | 56.0% | 51.0% | 52.9% | 13,228 | 9 weeks |
| Erith (London) | 51.1% | 52.0% | 50.4% | 51.6% | 5,809 | 7 weeks |
| West Wickham (London) | 52.1% | 51.2% | 50.8% | 51.6% | 12,249 | 11 weeks |
| Tilbury | 49.7% | 50.9% | 46.0% | 50.4% | 5,083 | 7 weeks |
| Mitcham (London) | 44.5% | 48.7% | 45.4% | 47.0% | 15,046 | 12 weeks |
| Hornchurch (London) | 45.2% | 47.0% | 43.4% | 46.3% | 8,694 | 23 weeks |
| Goodmayes (London) | 39.1% | 47.2% | 41.5% | 43.7% | 21,374 | 21 weeks |
| Belvedere (London) | 36.1% | 43.2% | 38.3% | 40.5% | 4,245 | 9 weeks |